Logo carousel. If your screen size is less than 768 pixels 2 logos will be shown, greater than 768 pixels and less than 992 pixels 4 logos will be shown, other 6 logos will shown. Use the previous and next buttons to navigate.
Create Your Heat Map in 2 Steps
1. Import Your Data
You can map any excel spreadsheet that contains a location column. The more granular your data, the better the result so try to include street addresses and zip codes.
2. Run Regional Heat Map
Create a regional heat map based on your zip code data to compare zip code performance.
Visualize Your Sales Marketing or Operations Data in Minutes
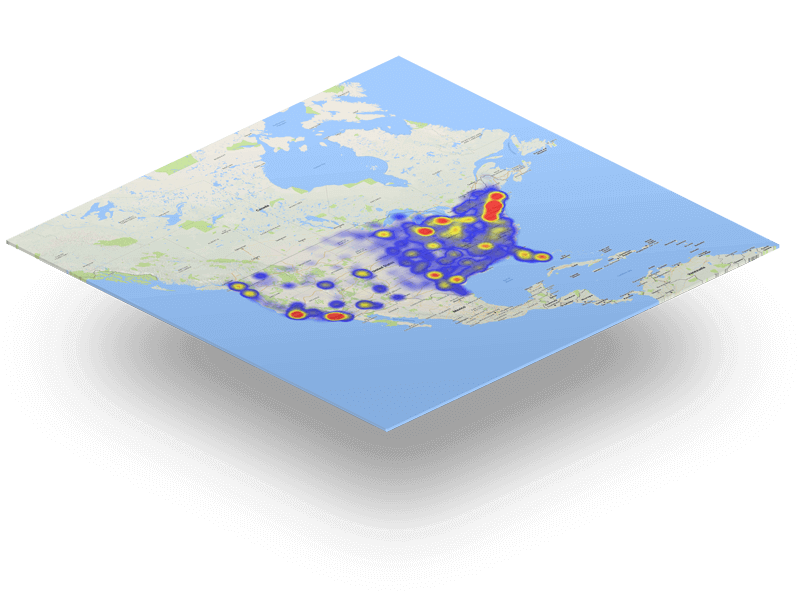
eSpatial's powerful engine will turn your data into insight-rich hot spots or regional heatmaps in minutes.
- Identify clusters of customers
- Uncover whitespaces or new areas to grow sales, locations, or operations
- Highlight new territory opportunities
- Uncover trends in product sales. Spot regional differences and identify new hotspots for growth
- Quickly spot areas for further investigation based on point density


